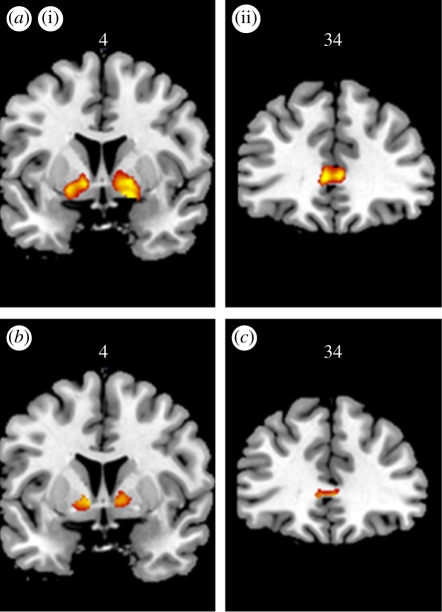
Figure 2.
Coronal sections through the brain showing (a(i)(ii)) the contrast of monetary wins minus non-win outcomes, at y = 4 (ventral striatum) and y = 34 (medial prefrontal cortex), thresholded at p < 0.05 corrected with family-wise error. (b) The contrast of near-miss outcomes minus full-miss outcomes, within regions sensitive to monetary wins, at y = 4 (ventral striatum; thresholded at t = 3.0 to better display extent of activation). (c) the interaction between near-miss outcomes (i.e. near-misses minus full-misses) and personal control (participant-chosen trials minus computer-chosen trials), within regions sensitive to monetary wins, at y = 34 (medial prefrontal cortex; thresholded at t = 3.0 to better display extent of activation). Data redrawn from Clark et al. (2009).

