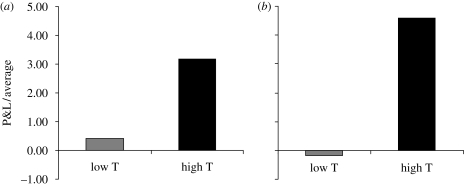
Figure 3.
P&L on low- and high-testosterone days. (a) P&L made between 11.00 and 16.00 for 17 traders on days when their testosterone levels were above their median level during the study (‘high T’) and on the rest of the days (‘low T’) (n = 17, paired t-test p = 0.008; Cohen's d = 0.97). P&Ls for each trader were standardized by dividing them by their 1-month average daily P&L. Standardized P&Ls were then averaged across all 17 traders. (b) Afternoon P&L for experienced traders only, i.e. ones with more than 2 years trading experience (n = 10, paired t-test p = 0.005; Cohen's d = 1.37).

