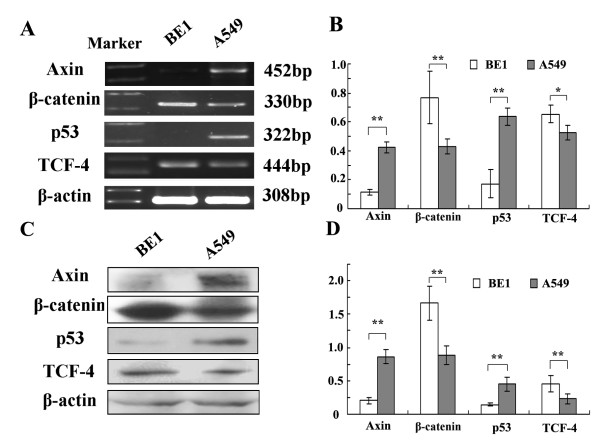
Figure 1.
The mRNA and protein expression levels of Axin and other factors in BE1 and A549 cell line. (A) RT-PCR analysis of BE1 and A549 cells using the indicated specific primers. (B) Quantitative representation of the RT-PCR analysis. (C) Western blot analyses of BE1 and A549 cells using specific antibodies to the indicated proteins. (D) Quantitative representation of the Western blot anlaysis. * P < 0.05, ** P < 0.01.

