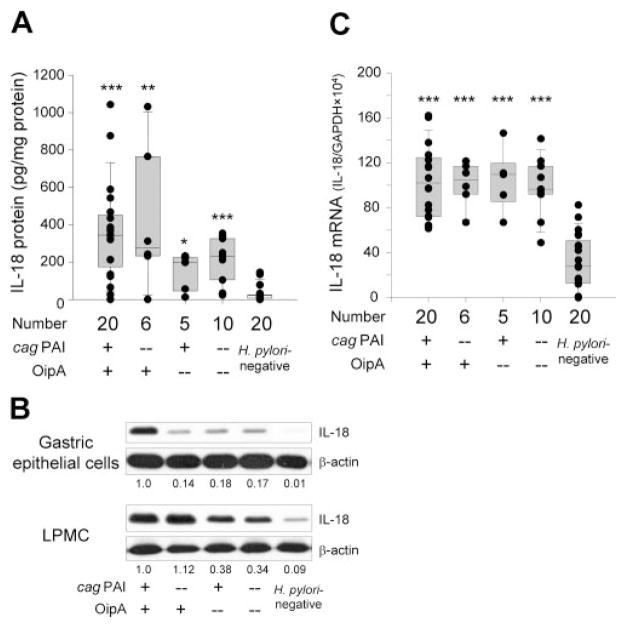
FIGURE 1.
IL-18 levels in the antral gastric mucosa. Mucosal IL-18 protein levels (pg/mg protein) (A) and mRNA levels (IL-18/GAPDH × 104) (C) are expressed as box plots. The ends of the bars indicate the 25 and 75 percentiles. The median is indicated with a line, and 10 and 90 percentiles are indicated with error bars. Data also are displayed using symbols. *, p < 0.05, **, p < 0.01 and ***, p < 0.001 compared with specimens without H. pylori infection by Mann-Whitney Rank Sum text (A) or non-paired t test (C). Mucosal IL-18 protein levels in isolated gastric epithelial cells and LPMC were measured by immunoblot (B). The number below the images represents the fold induction of IL-18/β-actin levels as compared with the levels of samples infected with cag PAI/OipA-positive strains.

