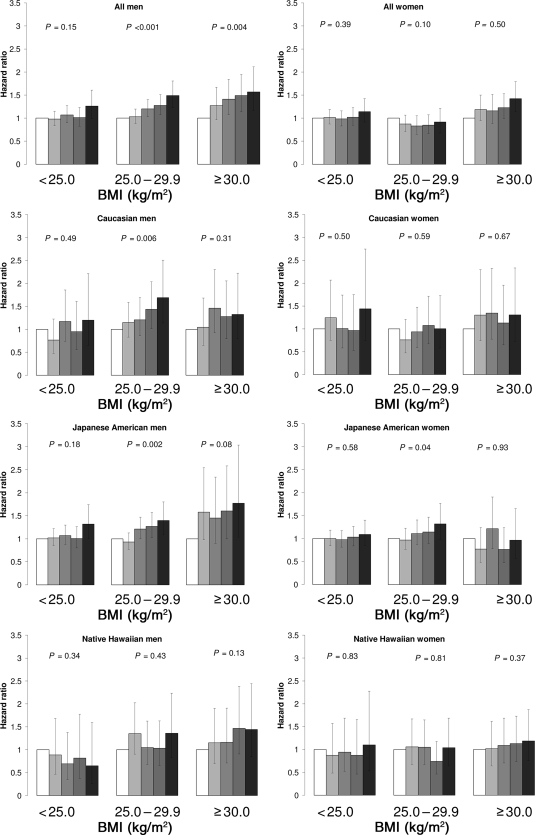
Figure 1.
Diabetes risk and “fat and meat” dietary pattern by weight status, Hawaii component of the MEC, 1993–2007. The models were stratified by age at cohort entry and adjusted for ethnicity (Japanese American and Native Hawaiian vs. Caucasian), physical activity (quintiles), education (12–15 and >15 vs. ≤12 years), BMI (continuous), energy intake (log transformed), alcohol intake (quintiles), smoking status (past and current versus never), marital status, and self-reported high blood pressure at baseline.

