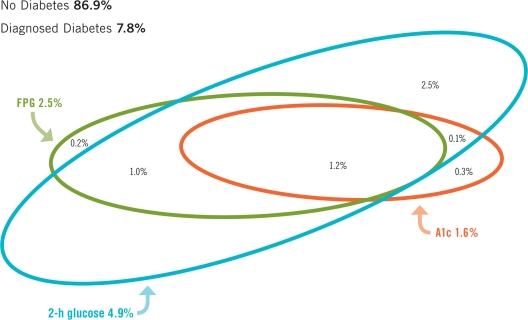
Figure 1.
Undiagnosed diabetes in the U.S. population aged ≥20 years by three diagnostic criteria—NHANES 2005–2006. Comparisons were calculated among individuals in the OGTT subsample in 2005–2006 (n = 2,017); consequently some estimates may differ slightly from those in Table 1. The thresholds of diagnostic criteria for diabetes were A1C ≥6.5%, FPG ≥7.0 mmol/1, and 2-h glucose ≥11.1 mmol/1. Point estimates (%) and 95% CIs for the categories are: A1C alone = 0.3 (0.0–0.7); FPG alone = 0.2 (0.0–0.5); 2-h glucose alone = 2.5 (1.9–3.2); A1C and FPG not 2-h glucose = 0.0; A1C and 2-h glucose not FPG = 0.1 (0.0–0.3); FPG and 2-h glucose not A1C = 1.0 (0.3–1.8); A1C, FPG, and 2-h glucose = 1.2 (0.5–2.0); total A1C = 1.6 (0.7–2.5); total FPG = 2.5 (1.2–3.8); total 2-h glucose = 4.9 (3.4–6.4); diagnosed diabetes = 7.8 (6.7–8.8); nodiabetes = 86.9 (84.6–89.1).

