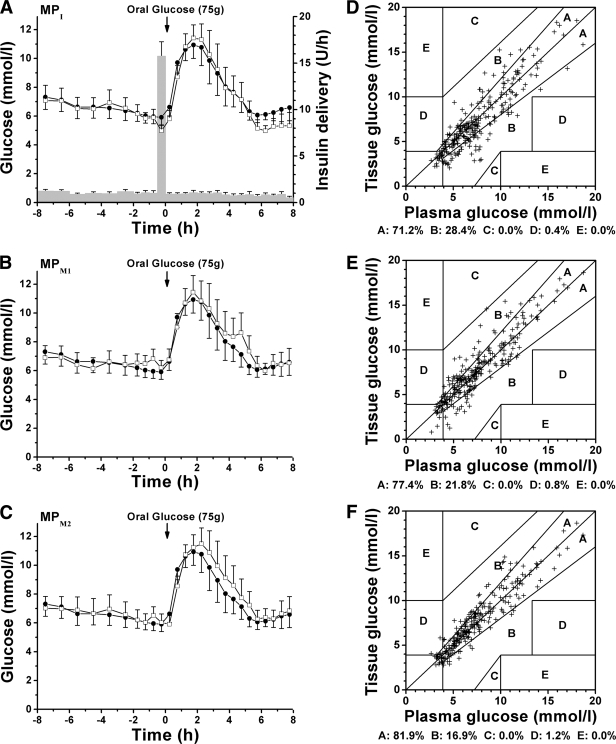
Figure 2.
Comparison of plasma and ISF-derived glucose concentrations observed during an overnight fast and OGTT in diabetic subjects. A: Average time course (n = 10, means ± SE) of plasma glucose concentration (●) and the tissue glucose concentration obtained with the MP catheter used for insulin delivery and simultaneous glucose sampling (MPI, □). A also shows the average time course (n = 10, means ± SE) of the insulin delivery rate (bars) used to control glucose concentration during experiments. B and C: Average time course (n = 10, means ± SE) of plasma glucose (●) and the tissue glucose obtained with the mannitol-perfused MP catheters (MPM1 and MPM2, □). D: Error grid analysis results for the insulin-perfused MP catheter (MPI): One of 268 data points (0.4%) fell outside of the clinically acceptable region A and B. E: Error grid analysis results for the mannitol-perfused catheter MPM1: Two of 266 data points (0.8%) were outside of the clinically acceptable region A and B. F: Error grid analysis results for the mannitol-perfused catheter MPM2: Three of 248 data points (1.2%) fell outside of the clinically acceptable region A and B. In A, the tendency toward lower tissue glucose concentrations than plasma glucose levels at the end of the OGTT is mainly caused by subject 8, whose tissue glucose concentration time course of the insulin-perfused catheter was an apparent outlier, with very low values during the last 4 h of the experiment (supplementary Fig. 1).

