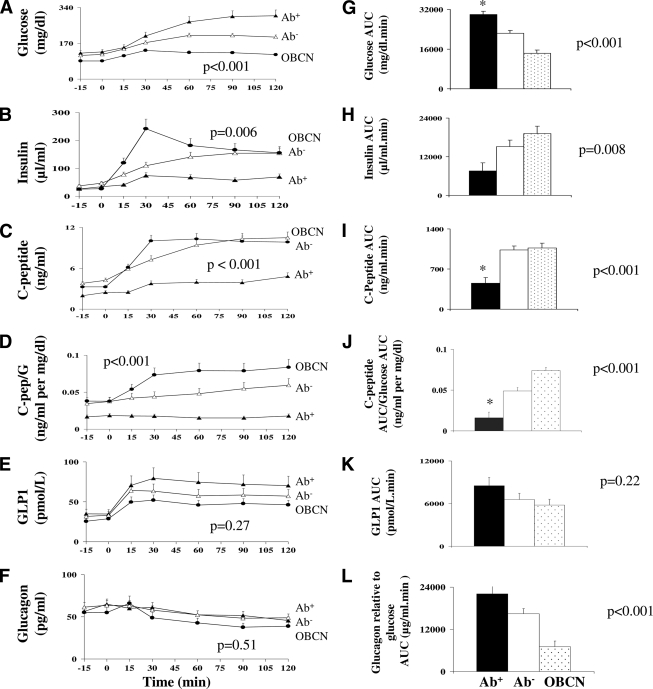
Figure 1.
A–F: Glucose, insulin, C-peptide, C-peptide–to–glucose ratio, GLP-1, and glucagon, respectively, during the OGTT in Ab− CDx-type 2 diabetes (▵) versus Ab+ CDx-type 2 diabetic patients (▴) versus obese control subjects (●). G–L: Area under the curve (AUC) for glucose, insulin, C-peptide, C-peptide–to–glucose ratio, GLP-1, and glucagon relative to glucose, respectively, during the OGTT in Ab− CDx-type 2 diabetes (□) versus Ab+ CDx-type 2 diabetes (■) versus obese control subjects ( ). Data adjusted for BMI. *P ≤ 0.001 for Ab+ vs. Ab− post hoc Bonferroni correction.

