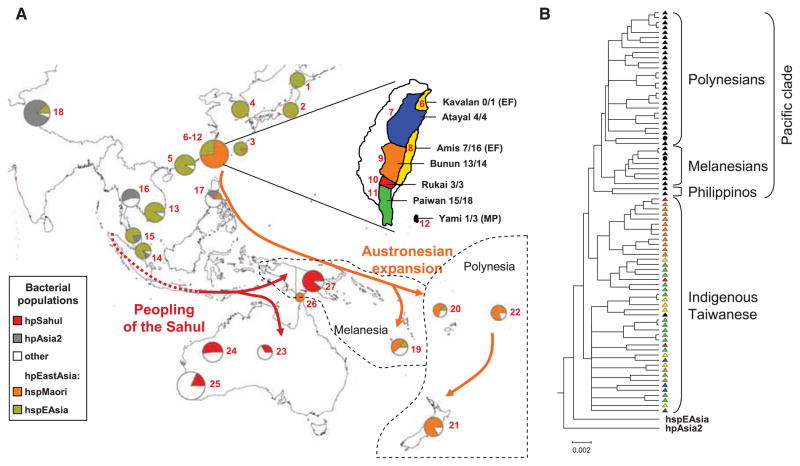
Fig. 1.
(A) The distribution of H. pylori populations in Asia and the Pacific. The proportions of haplotypes at each sampling location (red numbers; table S1) that were assigned to different bacterial populations are displayed as pie charts whose sizes indicate the numbers of haplotypes. The geographic location of Melanesia and Polynesia is depicted. The term “Austronesia” refers to the entire region inhabited by Austronesian-speaking people from Madagascar through to the Easter Islands. (Inset) A detailed map of Taiwan showing the distribution of aboriginal tribes. The names of the tribes plus the proportion of hspMaori haplotypes among all haplotypes are shown in black at the right. The language-family designations are the same as the tribal names except where indicated by parentheses (EF, East Formosan; MP, Malayo-Polynesian). (B) Phylogenetic relationships among hspMaori strains (80% consensus of 100 ClonalFrame analyses). One haplotype each of hpAsia2 and hspEAsia was used to root the tree. Strains are color-coded according to Austronesian language family in (A). Two black circles within the Pacific clade indicate haplotypes isolated from the Torres Strait islands, and a black triangle among indigenous Taiwanese indicates an hspMaori haplotype from Yami.

