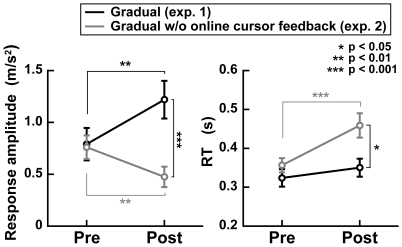
Figure 5. Response amplitudes to cursor perturbation and RTs after learning with and without online cursor feedback.
Left and right panels show the mean amplitudes of acceleration responses to the cursor perturbation and the mean RTs for the reaching initiation across subjects, respectively. Black lines indicate the gradual condition with online cursor feedback (exp. 1) and gray lines indicate the gradual condition without online cursor feedback (exp. 2). Note that the data indicated by the black lines are the same as those represented by the gray line in Fig. 4C (response amplitude) and the green line in top-right panel of Fig. 2B (RT). The asterisks (*, **, and ***) denote the significance of differences: p<0.05, p<0.01, and p<0.001, respectively.

