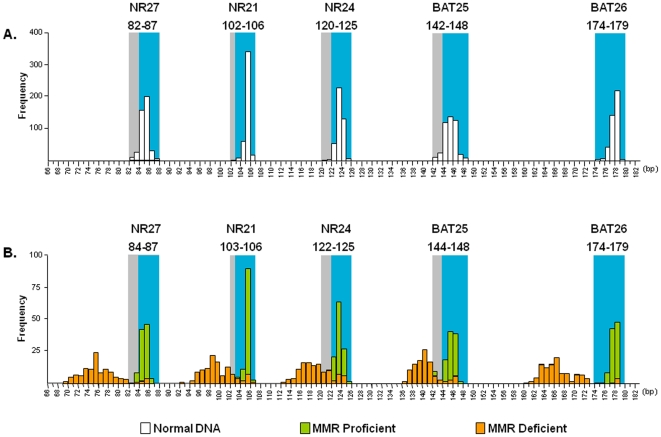
Figure 1. Frequency of allele size distribution for the five pentaplex markers.
A) Allele size distribution (in base pairs) from 213 normal DNA specimens. For each marker, blue shading indicates the adjusted QMVR, while the gray shading indicates the entire range of allelic size obtained from 426 germline alleles. B) Distribution of allele sizes in MMR-deficient (orange) and MMR-proficient (green) CRCs.

