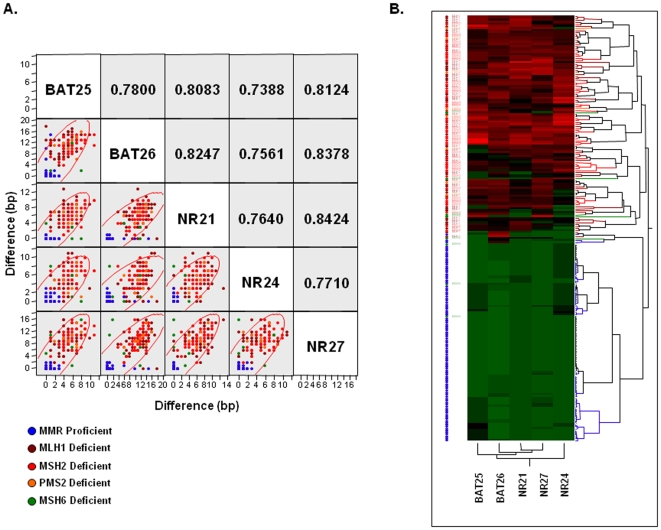
Figure 3. Correlation between various mono-nucleotide markers in the pentaplex PCR.
A) A scatter-plot matrix demonstrating the pair-wise correlation coefficient (r) between five microsatellite markers in the cohort of MMR-proficient and deficient CRCs. The Y and X-axis denote absolute differences in allele sizes between the tumor DNA and normal DNA. B) The figure shows hierarchical clustering analysis derived from 104 MMR-deficient and 99 MMR-proficient CRCs. The data are presented in matrix format in which the rows represent each CRC and the columns indicate the individual mononucleotide markers. The color scale represents the gradient (green to red) of absolute allele length differences between tumor and germline DNA from QMVR standardized data; green (no differences in allele size between tumor and normal DNA) to red (significant differences in allelic lengths between tumor and normal DNA).

