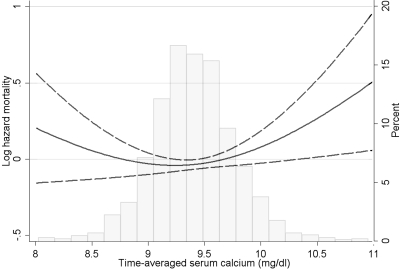
Figure 2.
Multivariable-adjusted log hazards (solid lines) and 95% CI (dashed lines) of all-cause mortality associated with time-averaged levels of serum calcium concentration in Cox models adjusted for age, race, CCI, diabetes mellitus, CVD, BP, body mass index, smoking status, the use of phosphate binders and calcitriol, enrollment period, estimated GFR, bicarbonate, phosphorus, ALP, blood hemoglobin, WBC count, percentage of lymphocytes, and 24-hour urine protein. Superimposed is a histogram showing the distribution of time-averaged serum calcium levels.

