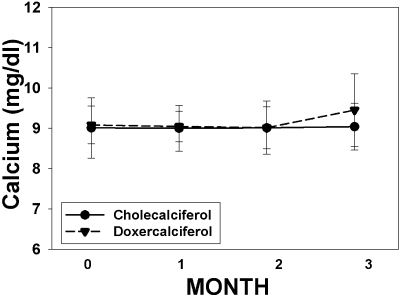
Figure 2.
Change in calcium over time. The change in calcium levels over the course of the study is graphed for subjects treated with cholecalciferol (solid circles, solid line) and doxercalciferol (solid triangles, dashed line). The numbers of subjects for months 0, 1, 2, and 3 were 22, 22, 20, and 20, respectively, for the cholecalciferol arm, and 25, 24, 21, and 20 for the doxercalciferol arm.

