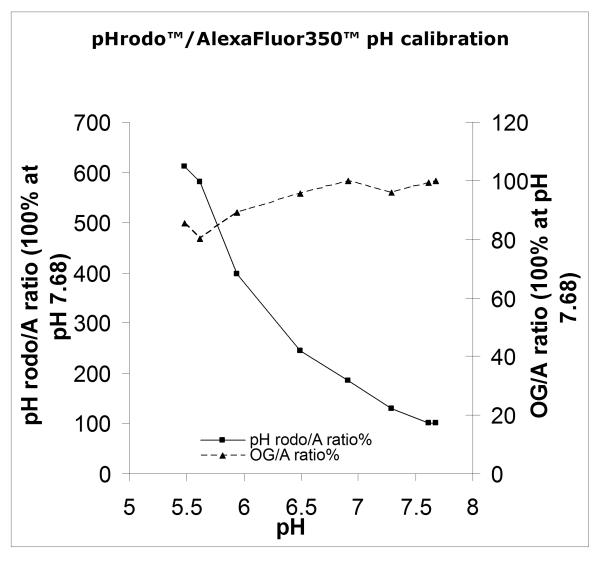
Figure 1.
pHrodo™Bioparticles (Invitrogen/Molecular Probes) were labeled according to Protocol 1 with OregonGreen™ SE and AlexaFluor350™ SE. The fluorescence of a 1μg/ml suspension in PBS at various pH was then measured in a Hitachi 4500 spectrofluorimeter (lexc 565, 488 and 357, lem 590, 530 and 450, respectively). The ratio of F590/F450 and F530/F450 was then calculated. The fluorescence of AlexaFluor350™ did not vary detectably over the pH range. Because the ratios were too disparate to permit reasonable comparison, the % of the ratio at each pH was calculated and is plotted here, the ratios at pH7.68 being arbitrarily defined as 100%.

