Fig. 4.
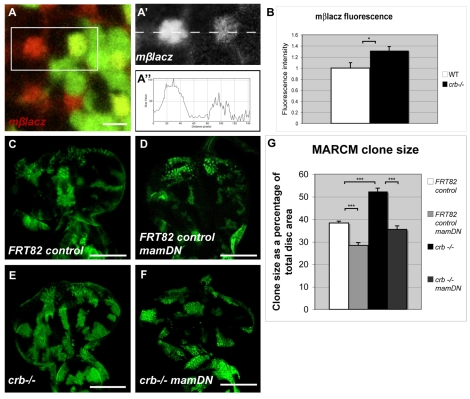
The crb overgrowth phenotype is dependent on N signalling. (A) crb11A22 clones in the eye imaginal disc marked by lack of GFP staining (green) and expressing mβlacZ (red). (A′) Close up of boxed area in A. (A″) Fluorescence intensity along the dashed line in A′. (B) Normalized mβlacZ fluorescence intensity per cell in WT and crb mutant clones. n=15 cells per genotype. *, t-test: P<0.05. (C) FRT82 control clones. (D) FRT82 control clones expressing mamDN. (E) crb11A22 clones. (F) crb11A22 clones expressing mamDN. Clones are positively labelled with GFP (green). (G) Clone size area. n=10 discs per genotype. ***, t-test: P<0.001. (B,G) Error bars represent the s.e. Scale bars: 5 μm in A; 50 μm in C-F.

