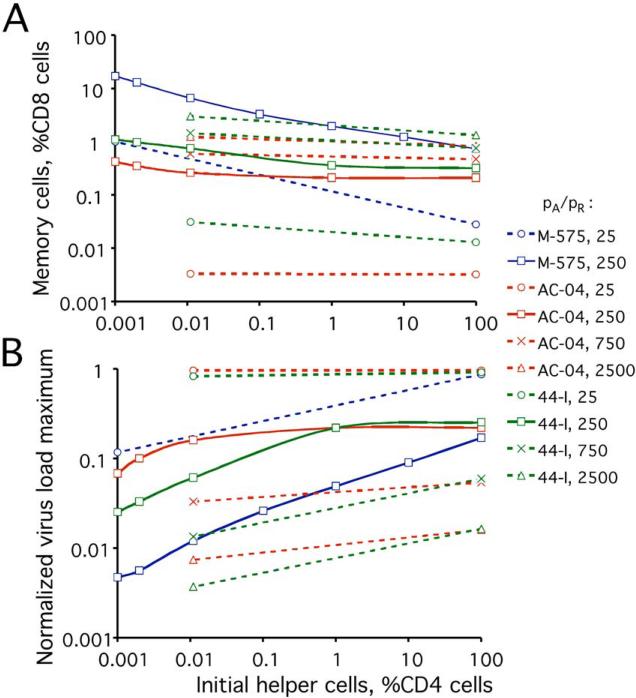
Figure 4. Critical condition of the transition to the low-virus steady state (or the oscillating state) after acute infection.
(A) Critical initial level of memory CTLs, Mc(0), required for the switch to the low-virus state or oscillating state, as a function of the initial helper cell level, HN(0)+HE(0). Cell levels are shown as percentage of CD4 T or CD8 T cell count in an average uninfected animal. (B) Decrease of the maximum virus load at the critical point, as compared to its value in a non-vaccinated animal. (A and B) The infectivity parameter ratio, pA/pR and identifiers of three unvaccinated animals from Ref. (Letvin et al., 2006), M-575 (blue), AC-04 (red), and 44-I (green), whose parameter sets were used for simulation (Table 1 and Appendix B), are shown in the legend. Solid lines with open squares: pA/pR=250. Dotted lines with other symbols: Other values of pA/pR, as shown.

