
Figure 5.
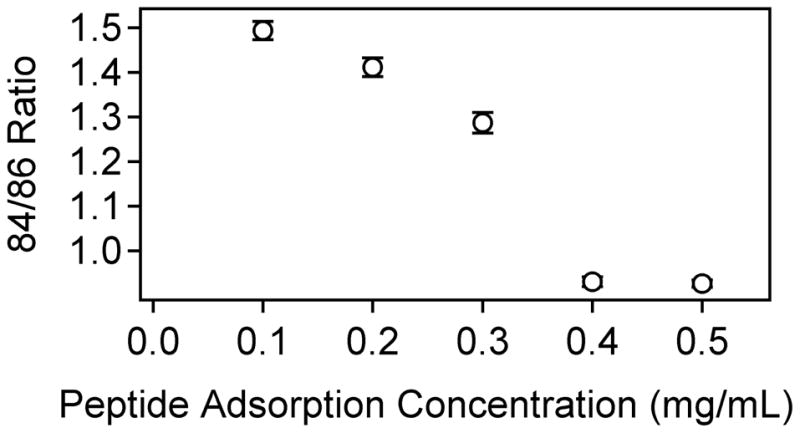
ToF-SIMS data showing the concentration-dependence of the 84/86 ratio for LKα14 on methyl SAMs. Error bars represent the standard deviation for each data point, and are present for each point although some are too small to be visible.
Official websites use .gov
A
.gov website belongs to an official
government organization in the United States.
Secure .gov websites use HTTPS
A lock (
) or https:// means you've safely
connected to the .gov website. Share sensitive
information only on official, secure websites.
ToF-SIMS data showing the concentration-dependence of the 84/86 ratio for LKα14 on methyl SAMs. Error bars represent the standard deviation for each data point, and are present for each point although some are too small to be visible.