
Figure 6.
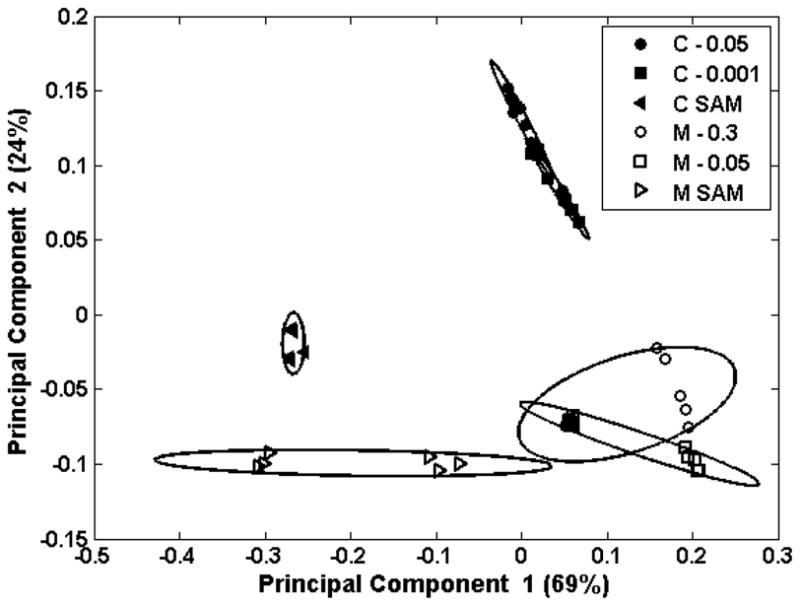

Figure 6a shows the PCA scores plot of PC 2 vs. PC 1 for LKβ15 on carboxyl (C) and methyl (M) SAMs. Numbers in the legend represent the peptide concentration in mg/mL at which the peptides were adsorbed onto the SAMs. PC 1 separates samples with peptide from those without. PC 2 separates the samples with predominantly leucine side-chains nearest the surface from those with other groups close to the surface. Figure 6b shows loadings for PC 1 and Figure 6c shows the loadings for PC 2. L labels the major peaks generated by leucine, K labels major peaks from lysine, and “Both” labels peaks found in both peak lists.