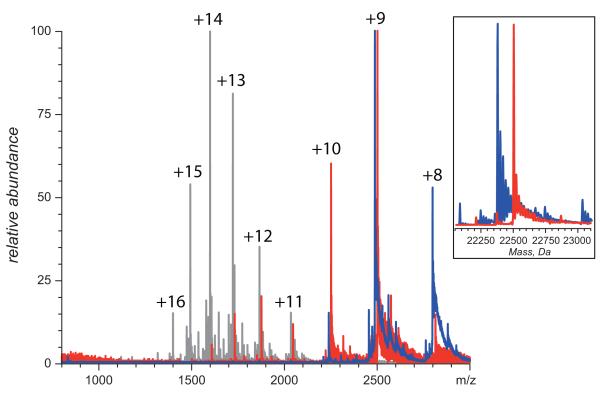
Figure 2.
ESI mass spectra of intact (blue) and NEM-alkylated IFN (red) buffer-exchanged to aqueous 100 mM ammonium acetate prior to MS analysis. The inset shows limited heterogeneity of IFN due to the presence of several glycoforms. Black trace shows an ESI mass spectrum of intact IFN acquired under strongly denaturing conditions (50% methanol, 6% acetic acid).

