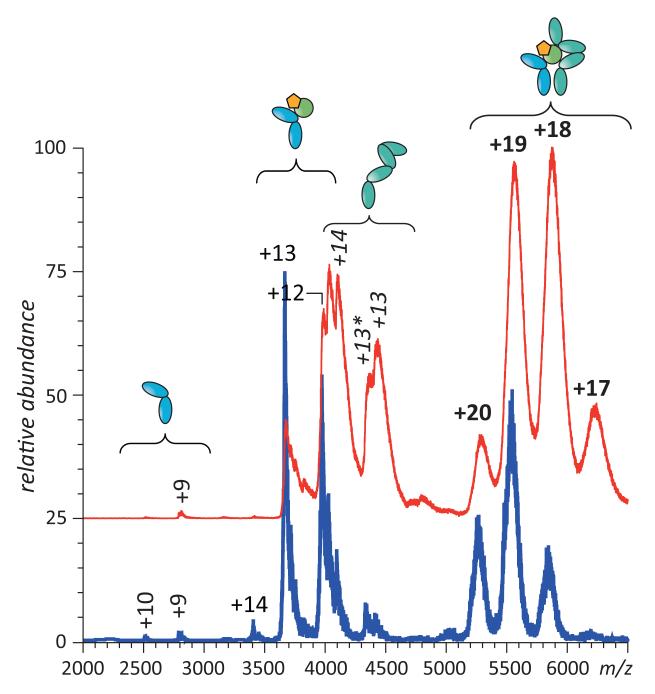
Figure 9.
ESI MS of NEM-IFN interaction with IFNAR1 and IFNAR2 in the presence of excess NEM-IFN and IFNAR2. Note that both free IFNAR1 and a binary complex NEM-IFN·IFNAR2 are present in the spectrum alongside the ternary complex. Mixing intact IFN with the two receptors results in complete elimination of either free IFNAR1 or the binary complex IFN·IFNAR2 depending on the relative abundance of each of the three proteins (blue trace).

