
Figure 4.
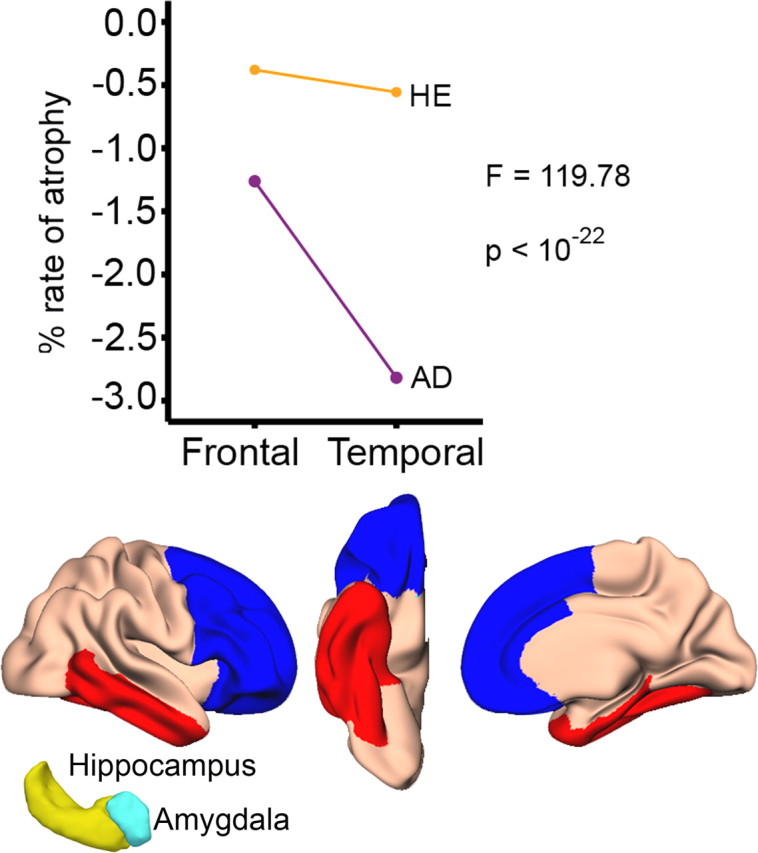
Frontal versus temporal effects of healthy aging and Alzheimer's disease. The line graphs show rate of atrophy for the frontal and the temporal regions in healthy elderly and AD patients. The regions are shown below (blue: frontal, red: temporal). In addition to the cortical areas shown, hippocampus and amygdala were included in the temporal region (yellow and cyan 3D figures). ANOVA showed a significant interaction between group and region: While the AD patients showed more atrophy in the temporal (−2.82%, SE = 0.14) than the frontal regions (−1.26%, SE = 0.11), the rate of atrophy between these two regions was comparable in the healthy controls (temporal: −0.56%, SE = 0.07/frontal: −0.38%, SE = 0.07).