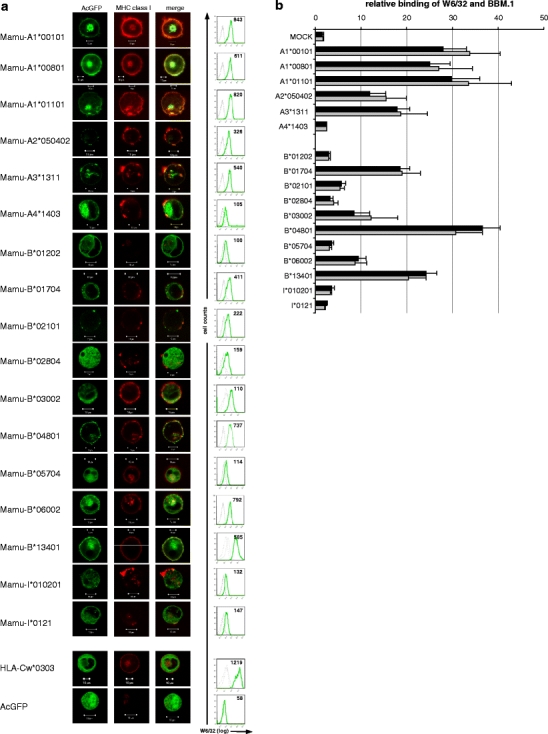
Fig. 1.

Analysis of Mamu-A and Mamu-B protein expression. a K562 cells were transiently transfected with expression constructs encoding AcGFP-tagged Mamu-A, Mamu-B or HLA-Cw*0303 or empty AcGFP vector. The latter two served as controls. Confocal microscopy: left panels show AcGFP fluorescence, middle panels show binding of monoclonal mouse anti-MHC class I antibody W6/32, right panels show merge. Flow cytometry: green lines show binding of W6/32, dotted grey lines are negative controls (empty AcGFP vector) and dashed grey lines show secondary antibody control (polyclonal PeCy5-coupled goat anti-mouse antibody). The mean fluorescence intensity (MFI) is given in the upper right corner. Results show one of at least three independent experiments. b AcGFP-tagged Mamu-A and Mamu-B expression constructs were transiently transfected in K562 and tested for binding of anti-MHC class I monoclonal antibody W6/32 and anti-beta-2-microglobulin antibody BBM.1 in flow cytometry. Relative binding is indicated as ratio of MFI (W6/32 or BBM.1)/MFI (mock transfection). The average of three independent experiments is shown and error bars denote SEM
