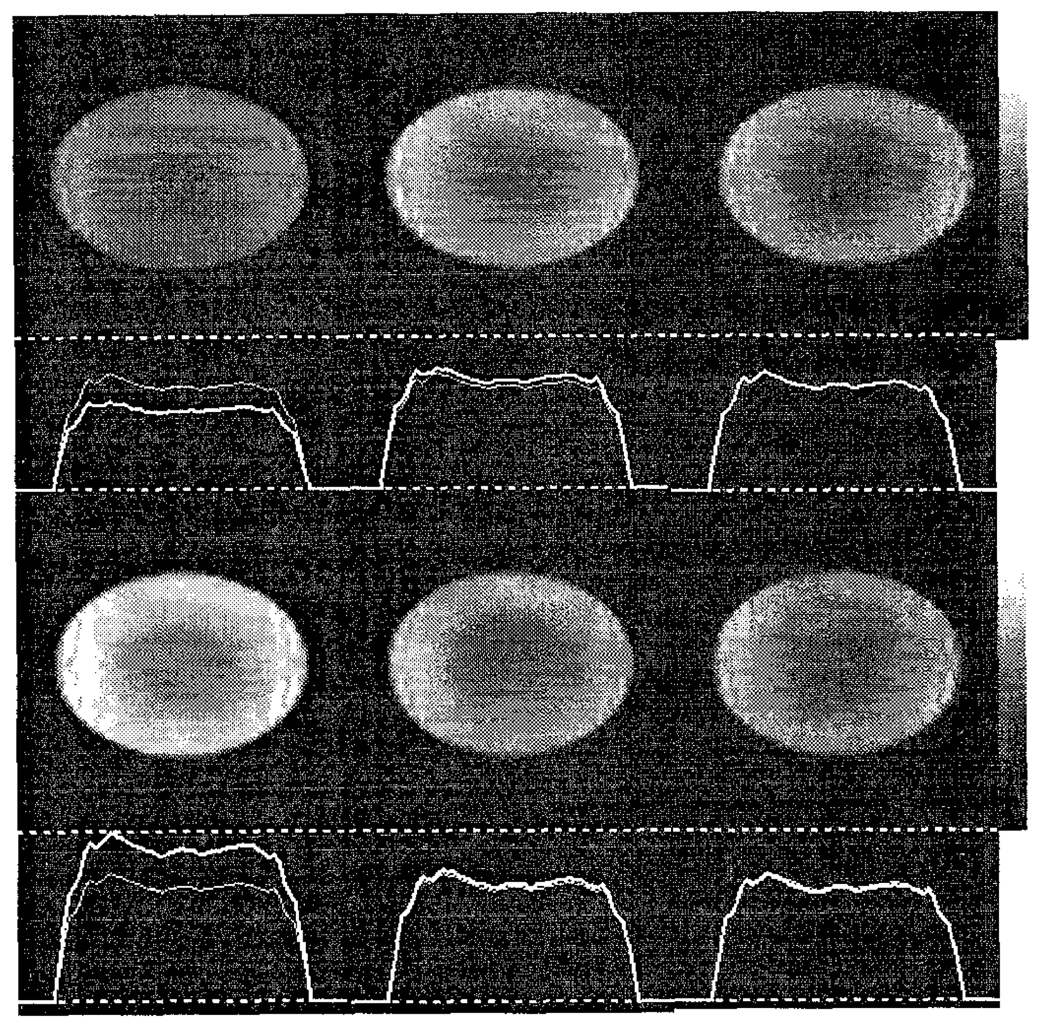
Fig. 11.
Variance images accompanied by horizontal profiles corresponding to the images shown in Figure 10. The profiles are all normalized to the peak height of the 49 kev window profile (bottom left), and the 20% window profile (top right) has been overdrawn on each profile (thinner line) to allow easier comparison.

