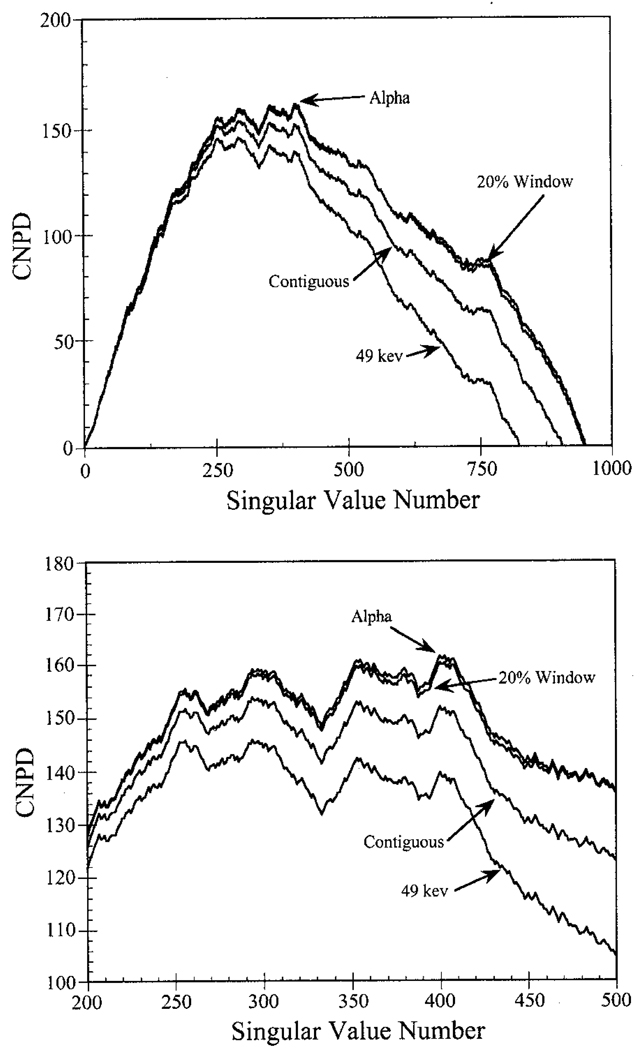
Fig. 8.
CNPD spectra for each case modeling scatter (top), and a blow-up of the peak region of the curves (bottom). The higher the CNPD, the lower the variance relative to the signal power. Window combination Alpha resulted in a slightly higher CNPD than for the 20% window, and the other windows resulted in markedly lower CNPD values.

