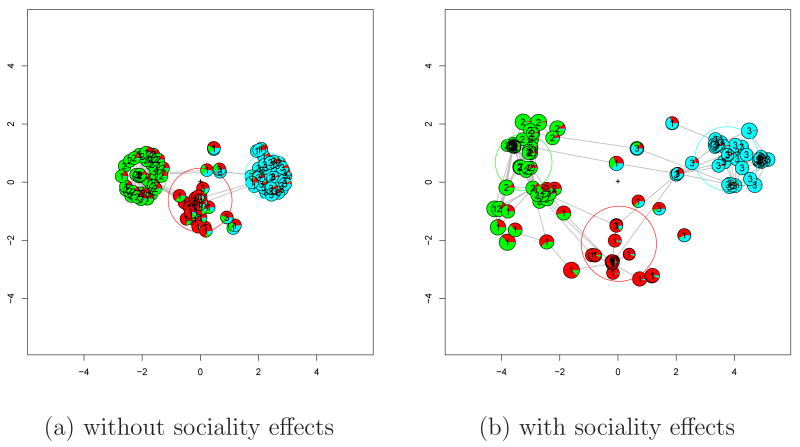
Fig. 6.
Minimum Kullback-Leibler locations from the models for the clustered network in Figure 4(b). In plot (b), the area of the plotting symbol is proportional to the conditional odds ratio of a tie for its vertex, due to its random sociality effect. The numbers 1–3 give the original cluster assignments.

