
Figure 5.
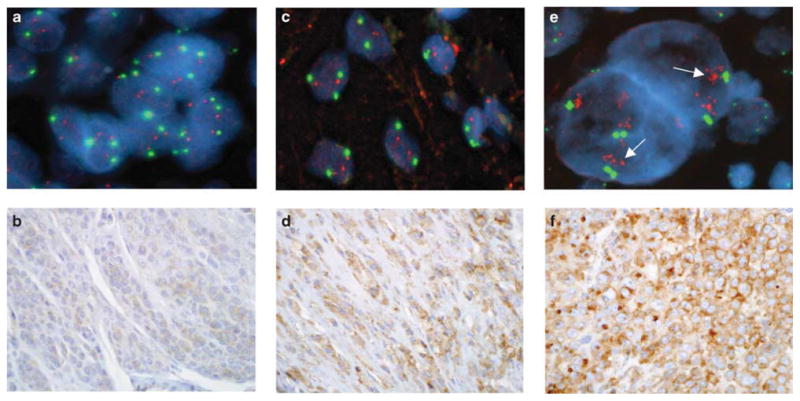
FISH analysis (a, c and e) and immunohistochemical staining (b, d, and f) of the same samples in a nevus (a and b), and melanomas without (c and d) and with (e and f) CTTN amplification. Arrows indicate amplification of CTTN seen as clusters of CTTN probe (red dots); green dots represent probe for centromeric region of chromosome 11.