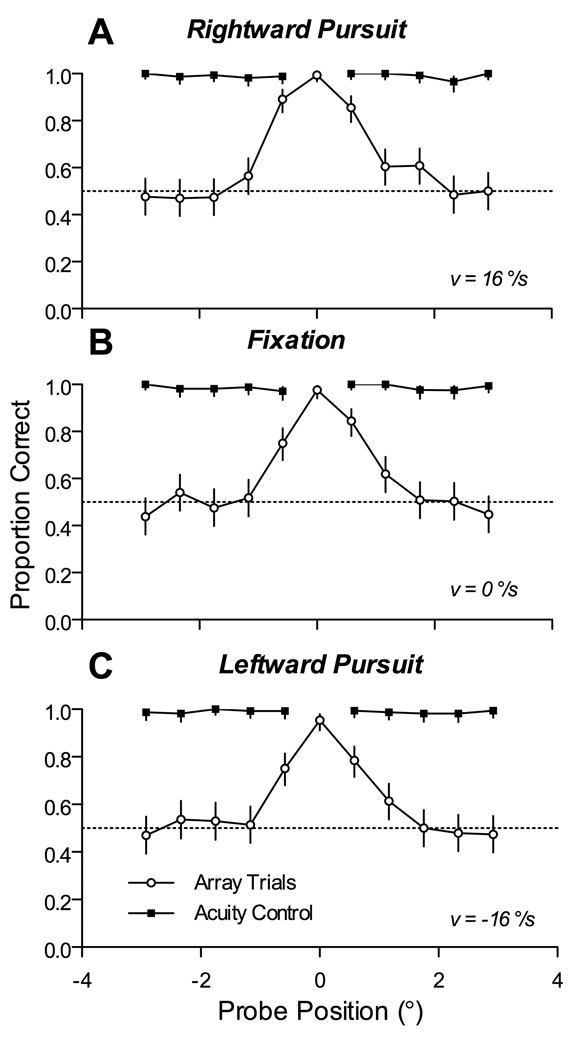
Figure 6.
Discrimination performance in the presence and absence of distracter characters in the array. The three plots show proportion of correct responses during rightward pursuit (A), fixation (B), and leftward pursuit (C). Solid squares indicate performance on the single character acuity task, whereas open circles represent performance on the discrimination task in the presence of the entire character array. Error bars represent 95% confidence intervals on the proportion correct pooled across all 4 subjects that participated in this experiment.

