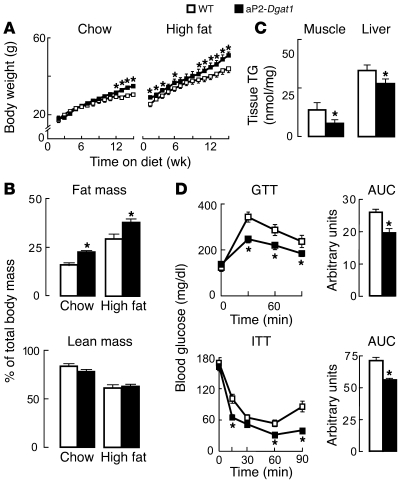
Figure 2. aP2-Dgat1 mice are prone to obesity but protected against its metabolic consequences.
(A) Growth curves (n = 9–12 per group; *P < 0.05) showing increased body weight and (B) DEXA analysis of body composition (n = 5-8 per group; *P < 0.05) showing increased adiposity in aP2-Dgat1 mice fed a chow or a 16-week high-fat diet. (C) Decreased TG content in the skeletal muscle and livers (n = 9–12 per group) of aP2-Dgat1 mice fed a high-fat diet (*P < 0.05). (D) Enhanced GTTs (top) and ITTs (bottom) in aP2-Dgat1 mice fed a high-fat diet (*P < 0.05) (n = 5–11 per group).

