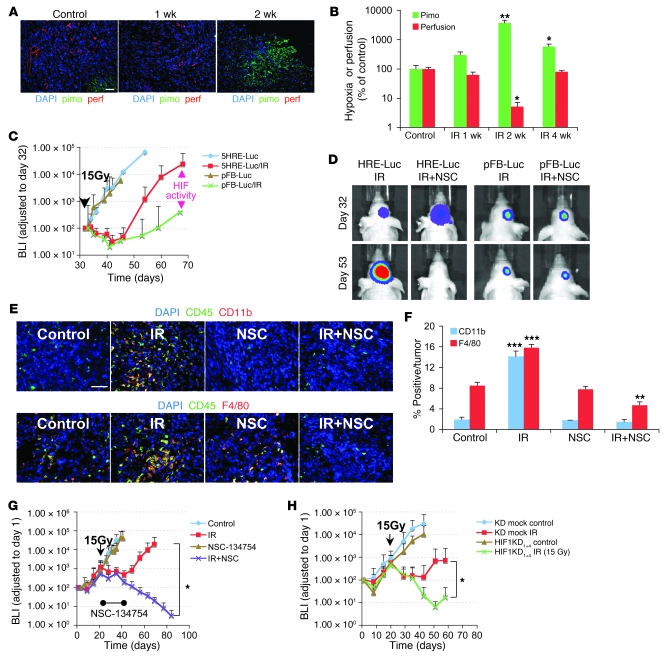
Figure 2. HIF-1 activity is increased in irradiated tumors and is necessary for influx of BMDCs and tumor recurrence after irradiation.
(A) Representative images of IHC staining for hypoxia (pimonidazole [pimo]) and functional vessels (lectin perfusion [perf]) in i.c. tumors after irradiation. Scale bar: 50 μm. (B) Quantification of hypoxic areas and vessels in the tumors of A. Error bars indicate SEM. *P < 0.05, **P < 0.01 versus control. Note the log scale on the ordinate. (C) BLI of 5HRE-Luc or pFB-Luc U251 i.c. tumors after a single dose (arrowhead) of irradiation on day 32. The divergence of the 2 curves starting at about 2 weeks after irradiation indicates increased HIF-1 activity. Error bars indicate SD. (D) Effect of NSC-134754 on inhibition of HIF-1 activity in vivo. 5HRE-Luc or pFB-Luc U251 tumor–bearing mice were treated with 15 Gy of irradiation, followed by daily injection of NSC-134754 for 3 weeks. Images were taken on the day of irradiation and 3 weeks later. (E) IHC staining for leukocyte (CD45) and monocyte (CD11b, top row) or macrophage (F4/80, bottom row) infiltration into i.c. tumors. Tumors were harvested on the day of irradiation for controls and 17 days after irradiation in treatment groups. Scale bar: 50 μm. (F) Quantification of CD11b+ and F4/80+ cell influx in tumors of E. Error bars indicate SEM. **P < 0.01, ***P < 0.001 versus control. (G) Growth curves of i.c. tumors treated with irradiation, NSC-134754, irradiation+NSC-134754, and control (n = 5 per group). Error bars indicate SD. *P < 0.05. (H) Growth curves of orthotopic U251/pSR (vector) and U251 HIF1KD1+4 tumors using BLI (n = 7). A whole brain irradiation was given on day 22. Error bars indicate SD. *P < 0.05.

