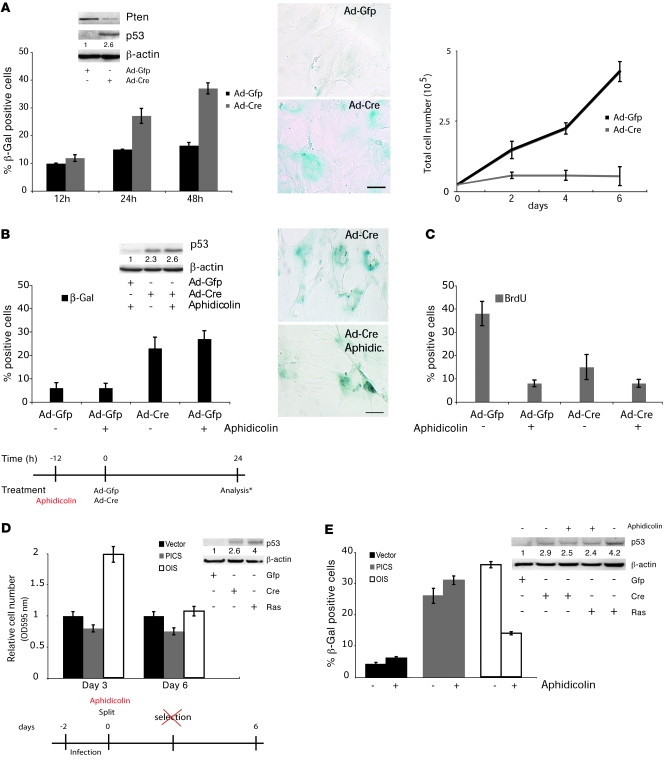
Figure 1. Senescence driven by Pten loss occurs in the absence of cellular proliferation.
(A) Western blot analysis of Ptenlx/lx MEFs infected with Ad-GFP or Ad-Cre, according to the scheme in Supplemental Figure 1E. β-gal staining for senescence and its quantification. Scale bar: 10 μm. Growth curve of Ptenlx/lx MEFs after infection with Ad-GFP or Ad-Cre. (B) Quantification of β-gal staining for senescence and Western blot analysis for p53 in Ptenlx/lx MEFs treated according to the experimental timeline. The asterisk denotes analysis through either Western blotting or β-gal staining. Images show β-gal staining for senescence (at 24 hours). Scale bar: 10 μm. (C) Quantification of BrdU incorporation in Ptenlx/lx MEFs infected as in B. (D) Analysis of cellular proliferation and Western blot analysis for p53 of Ptenlx/lx primary MEFs infected with retroviral control vector, H-Ras (OIS), and Cre (PICS), as measured by relative cell number over a 6-day period, and followed without selection. Note that the absence of selection was required, since H-Ras induced hyperproliferation 2 days after the infection of MEFs (a shorter time point than that observed in human cell lines; ref. 18), and the selection phase masked this phenomenon. Experimental design for the experiment is shown in the lower panel. (E) Quantification of β-gal staining and Western blot analysis for p53 at day 6 for Ptenlx/lx primary MEFs infected as in D (see experimental design in D). Numbers in the Western blots indicate densitometrically determined protein levels relative to β-actin (A, B, D, and E). Error bars show SD (A–E).

