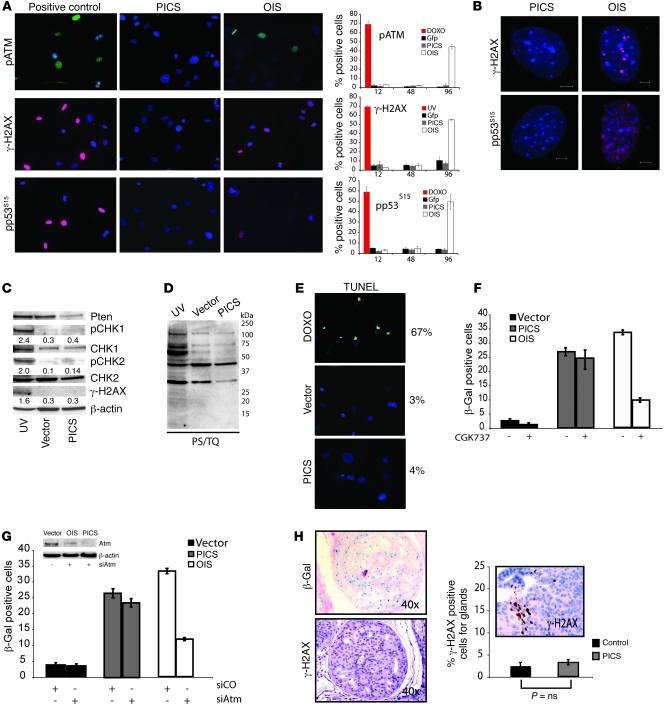
Figure 2. Senescence driven by Pten loss occurs in the absence of DNA damage.
(A) Immunofluorescence staining and its quantification to detect SDF in primary Ptenlx/lx MEFs undergoing Cre (PICS) and H-Ras infection (OIS). Representative images of phospho-ATM (pATM), γ-H2AX, and phospho-p53 (Ser15) (pp53S15) staining. MEFs treated with doxorubicin (DOXO) and UV were used as controls as indicated. (B) Representative images of γ-H2AX and phospho-p53 DNA damaged foci in MEFs treated as in A. Scale bar: 5 μm. (C) Western analysis for DDR markers in UV-treated primary WT MEFs, proliferating primary MEFs (vector), or MEFs undergoing PICS. Numbers in Western blots indicate protein levels for pCHK1, pCHK2, and γ-H2AX relative to β-actin. (D) Western analysis for substrates phosphorylated by ATM/ATR (phospho-S/TQ, PS/TQ) in UV-treated, control, and PICS. (E) TUNEL analysis in proliferating MEFs or MEFs undergoing PICS. WT MEFs treated with doxorubicin were used as a control. (F) Quantification of β-gal staining (at day 6) in Ptenlx/lx MEFs infected as in A and treated with the ARM/ATR inhibitor CGK737 after infection. (G) Quantification of β-gal staining in MEFs infected as in A and transfected with either a control (siCO) or ATM-specific siRNA (siAtm). Western-blot analysis for ATM in MEFs infected and treated as indicated. (H) β-gal and phospho–γ-H2AX staining and its quantification in prostates from 8-week-old Ptenpc–/– mice with prostatic intraepithelial neoplasia. The graph shows γ-H2AX staining in a positive control (a Ptenpc–/– mouse with invasive carcinoma). P values were determined by Student’s t test. Error bars show SD (A and F–H). Original magnification, ×10 (A and E); ×200 (inset in H).

