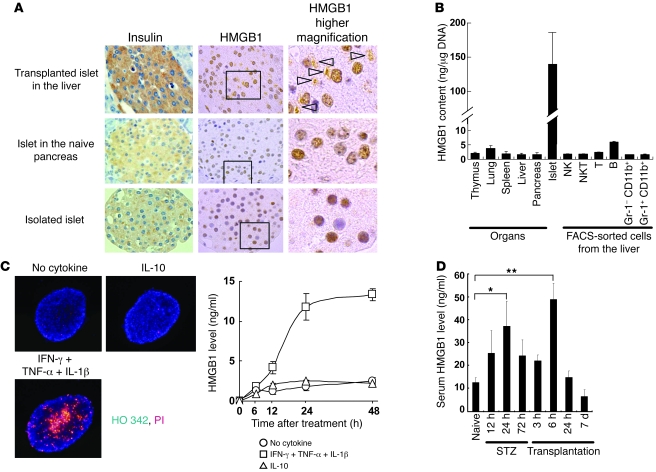
Figure 3. HMGB1 production in tissues and cell types.
(A) Photomicrographs of islets. Islet cells 3 hours after transplantation in the liver (top row) and those of naive pancreas or isolated islets were examined. Sections stained with anti-insulin or anti-HMGB1 followed by staining with hematoxylin are shown. In general, HMGB1 was detected in the nucleus (brown), while some was detected in cytoplasm, as indicated by arrowheads. Original magnification: ×100 (first and second columns) and ×800 (third column). Boxed regions in the second column were enlarged. (B) HMGB1 contents (ng/μg DNA) of individual organs (n = 5), isolated islets, or FACS-sorted liver MNCs (n = 3). (C) Left panels: Fluorescence photomicrographs of isolated islets (original magnification, ×200) stained with HO 342 (blue) and PI (red) at 24 hours after in vitro culture with or without IFN-γ, TNF-α, and IL-1β (20 ng/ml each) or IL-10 (20 ng/ml). Right panels: HMGB1 levels in the culture (200 cells/dish) were also measured at the indicated time points in the absence of cytokine or the presence of cytokine mixtures or of control cytokine (IL-10). The values are expressed as the mean ± SD in each group (n = 5). (D) Serum HMGB1 levels were measured after STZ injection and also after transplantation of 400 syngeneic islets, which had been performed 72 hours after STZ injection (n = 5–6). The values are expressed as the mean ± SD. *P < 0.05; **P < 0.01.

