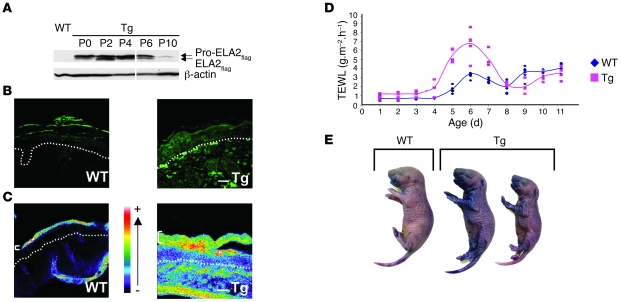
Figure 4. Skin barrier defect is linked to ELA2flag expression and activity.
(A) Immunodetection of ELA2flag (pro-form and active forms) in Tg-ELA2 epidermal extracts. At birth (P0), only the pro-ELA2flag was detected. Active ELA2flag is detected from P2 to P6. Lanes were run on the same gel but were noncontiguous (white lines). (B) Immunofluorescence analysis showing expression of ELA2flag in the granular layer of the epidermis of Tg-ELA2 at P4. The dotted line represents the basal membrane of the epidermis. Scale bar: 125 μm. (C) In situ zymography analysis showing a strong elastolytic activity in suprabasal layers of the epidermis (brackets) and in the dermis of Tg-ELA2 mice. Activity intensity is indicated in a pseudocolor gradient ranging from 0 (dark) to 255 (white). The dotted line represents the basal membrane of the epidermis. Scale bar: 200 μm. (D) TEWL measurements. Between day 4 and day 8, the TEWL values were higher in Tg-ELA2 animals compared with the WT (up to 3.2 times on day 5). After day 8, TEWL values of WT and transgenic mice were similar. Charts represent each individual value (dot) and average (line). (E) Whole-mount dye penetration assay performed at day 4. Transgenic animals displayed skin areas with blue staining revealing an outside-in skin barrier defect compared with uncolored WT mice.

