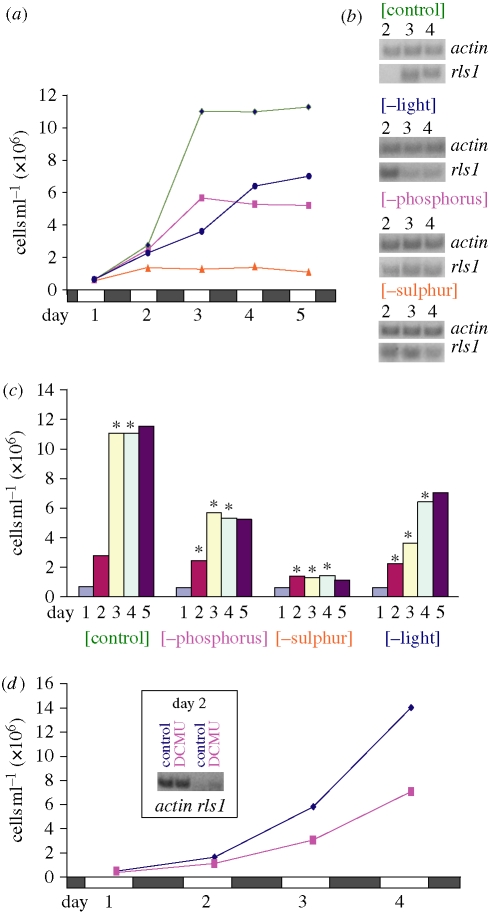
Figure 1.
Chlamydomonas reinhardtii growth and rls1 expression during phosphorus, sulphur and light deprivation. (a) Growth curves of control and deprived C. reinhardtii cultures; open and solid boxes indicate the succession of light and dark phases. Green line, control; blue line, minus light; purple line, minus phosphorus; orange line, minus sulphur. (b) Expression of rls1 (RNA was extracted 4 h before the onset of dark; semi-quantitative RT–PCR; Nedelcu & Michod 2006) in the control and deprived cultures from (a); several independent experiments showed similar expression patterns (data not shown). (c) Correspondence between time of rls1 induction (indicated by asterisks) and decline in reproduction potential of control and deprived C. reinhardtii cultures from (a) (note that as cells divide during the dark phase, the induction of rls1 in a given day will affect the division in the next dark phase and will reflect in the cell counts of the following day). (d) Induction of rls1 in the presence of the photosynthetic electron transport inhibitor, DCMU (RNA was extracted 24 h after the addition of the inhibitor; i.e. 5.5 h into the light phase of day 2). Blue line, control; purple line, DCMU.

