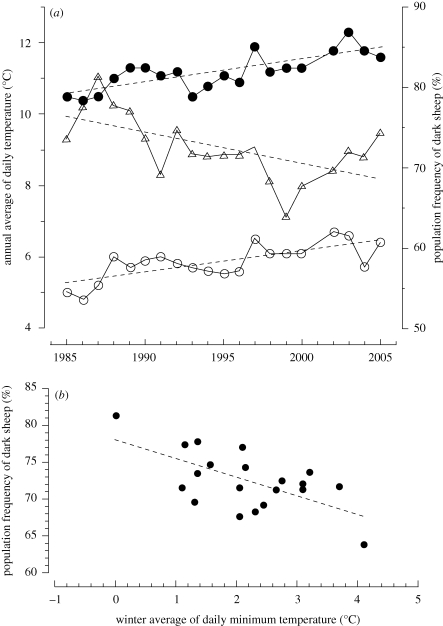
Figure 1.
(a) Annual average of daily maximum (closed circles) and minimum (open circles) ambient temperature at Stornaway and the proportion of dark sheep in the St. Kilda population (open triangles, data read from fig. 2a in Gratten et al. 2008) for the years 1985 to 2005. (b) The proportion of dark sheep on St. Kilda in each year from 1985 to 2005 plotted against the average minimum ambient temperature during winter in the previous year.

