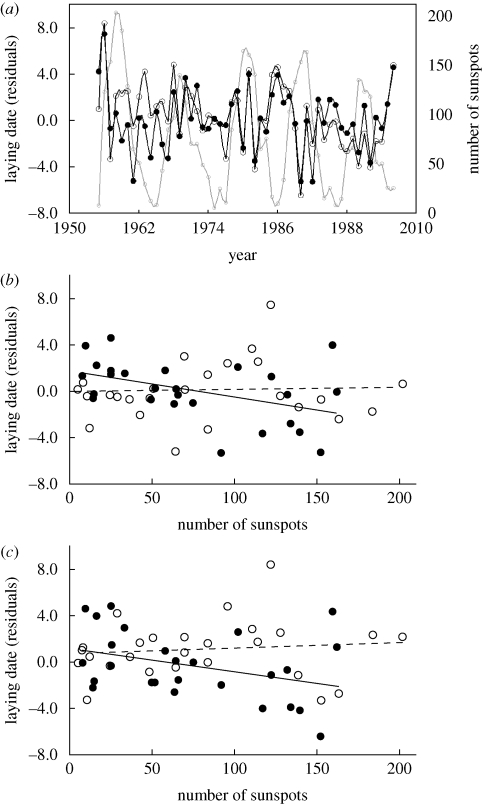
Figure 1.
(a) Annual fluctuation in laying date compared with fluctuations in sunspot numbers. Laying date of (b) great and (c) blue tits versus sunspots. Because of the interaction between year (as a continuous variable) and sunspots, the data have been split solely for the purposes of illustration into those for 1955–1980 (open circle, dashed line) and for 1981–2006 (filled circle, solid line). Laying dates of both species are the residuals from the model, with population and temperature as explanatory variables.

