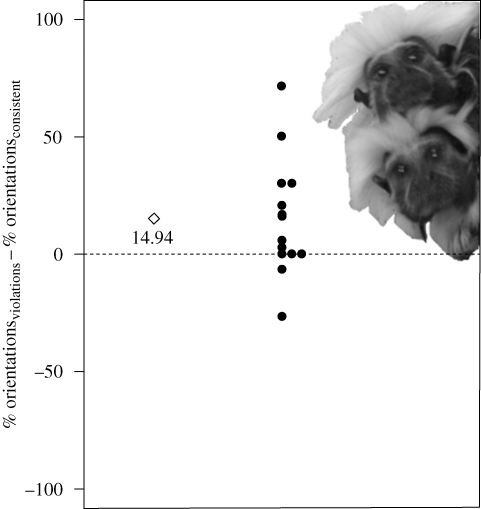
Figure 1.
Dots represent differences between the proportions of orientations to violations and consistent items, respectively, for individual monkeys; the diamond, sample average; and the dotted line, the chance level of 0. Most monkeys oriented more towards violations than to consistent test items.

