
Figure 5.
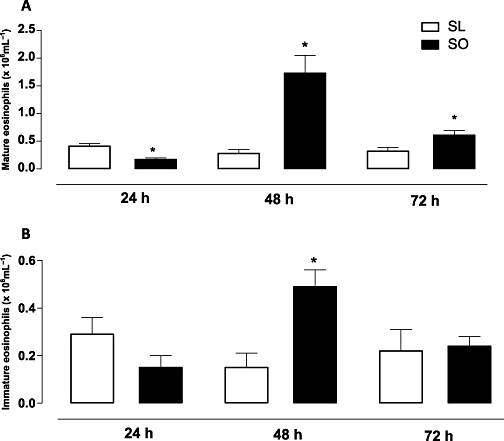
The effects of obesity on the counts of mature (A) and immature eosinophils (B) in bone marrow at 24, 48 and 72 h following intranasal challenge with ovalbumin in the sensitized mice. Each column represents the mean ± SEM (n= 7 each group) for ovalbumin-sensitized lean (SL) and ovalbumin-sensitized obese (SO) mice. *P < 0.05 compared with the respective SL group.