
Figure 3.
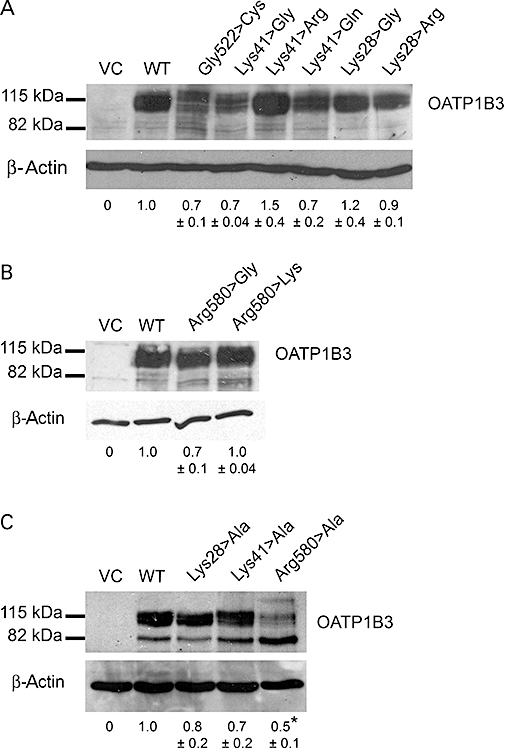
Representative immunoblot analysis of the OATP1B3 mutants at position Lys28, Lys41 and Arg580. The total OATP1B3 expression of the mutants Lys28, Lys41 and Arg580, and the control mutant Gly522>Cys compared to the WT and VC are shown. The results of densitometric analyses are given below. The data are expressed as mean ± SEM in arbitrary units (a.u.). No significant differences in the protein expression (P > 0.05) of the control mutant (Gly522>Cys) and the other mutants except for Arg580>Ala (P < 0.05) compared to OATP1B3 WT were observed (one-way Anova with Dunnett's multiple comparison test). (A) Mutants of Lys41 and Lys28; (B) mutants of Arg580; (C) mutants of Lys28, Lys41 and Arg580 to alanine. *P < 0.05; different from WT.