
Figure 4.
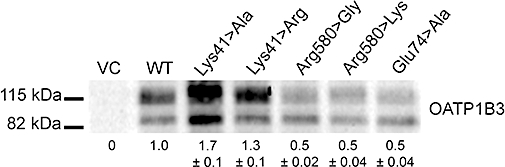
Representative immunoblot analyses of the cell surface protein expression of OATP1B3 mutants at positions Lys41, Arg580 and Glu74 compared to the WT and VC are shown. The results of densitometric analyses are given below. The data are expressed as mean ± SEM in arbitrary units (a.u.).