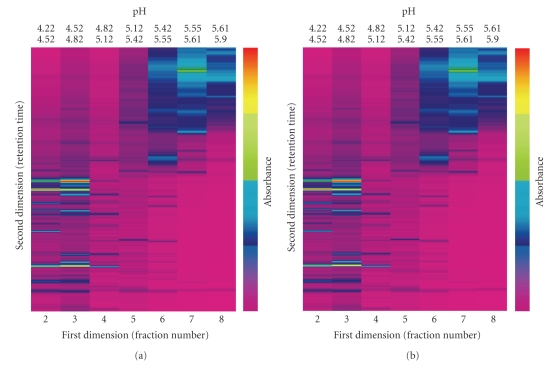
Figure 1.
Virtual 2D maps created by the software “ProteoVue” for two independent untreated samples. Proteins were extracted as described in the Materials and Methods Section. Equal amounts of protein (1.3 mg) were loaded into the 1st dimension separation column (HPRP). This figure shows the isoelectric point (pI) fractions (from 4.22 to 5.9) for two independent biological replicates.

