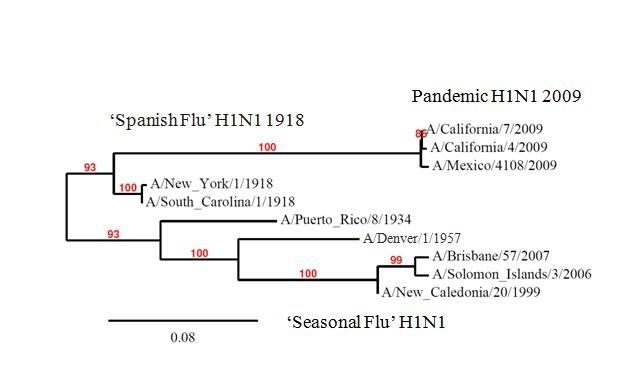
Figure 3. Genetic relatedness of HA from historical strains of influenza H1N1. The tree includes select H1N1 influenza isolates of the classic swine and human influenza lineages (see Materials and Methods for database accession numbers). Phylogenetic trees were inferred from hemagglutinin amino acid sequences using the maximum likelihood method. Bootstrap analysis values are shown above the branches. The scale bar indicates the number of amino acid residue changes per unit length of the horizontal branches.

