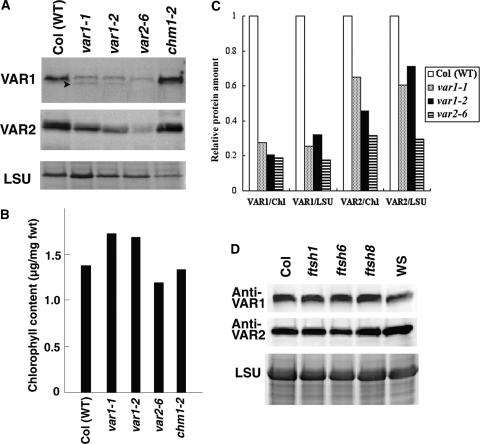
Figure 7.
VAR1 and VAR2 Levels in Col and Variegated Mutants.
(A) Immunoblot analysis using Anti-VAR1 and Anti-VAR2. Total proteins were isolated from wild-type Col (WT), var1-1, var1-2, var2-6, and chm1-2 plants and separated by SDS-PAGE, and duplicated filters were reacted with Anti-VAR1 or Anti-VAR2. The same samples were stained with Coomassie brilliant blue, and the bands corresponding to the large subunit of ribulose-1,5-bisphosphate carboxylase (LSU) are shown at bottom. Arrowheads indicate bands corresponding to degradation products.
(B) Chlorophyll content of the protein extracts used in (A).
(C) Quantification of the protein levels detected by Anti-VAR1 and Anti-VAR2 in Col and variegated mutants. Signals detected by immunoblot analysis (A) were normalized according to either chlorophyll content (B) (VAR1/Chl and VAR2/Chl) or LSU (VAR1/LSU and VAR2/LSU). We repeated the experiments at least five times and obtained similar results. Results of a representative experiment are shown.
(D) Immunoblot analysis of total proteins from Col, ftsh1, ftsh6, ftsh8, and Wassilewskija (WS) probed with Anti-VAR1 and Anti-VAR2. The same samples were stained with Coomassie brilliant blue, and the bands corresponding to LSU are shown at bottom.

