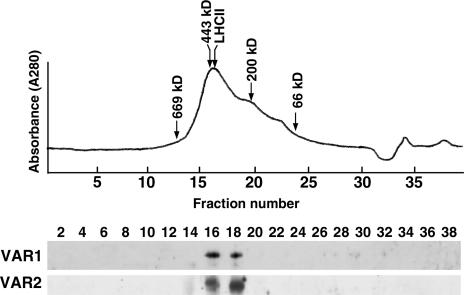
Figure 9.
Gel Filtration Profile of the Thylakoid Membrane Proteins and Immunoblot Analysis.
Fraction 10 from the sucrose density gradient of thylakoid membranes (solubilized with 0.2% DM; see Figure 8B) was subjected to gel filtration using a Superose 6HR column. The elution profile measured by absorbance at 280 nm (A280) is shown at top. Fractionated eluates were subjected to immunoblot analysis with Anti-VAR1 and Anti-VAR2, as shown at bottom. Numerals above the gels indicate fraction numbers.

