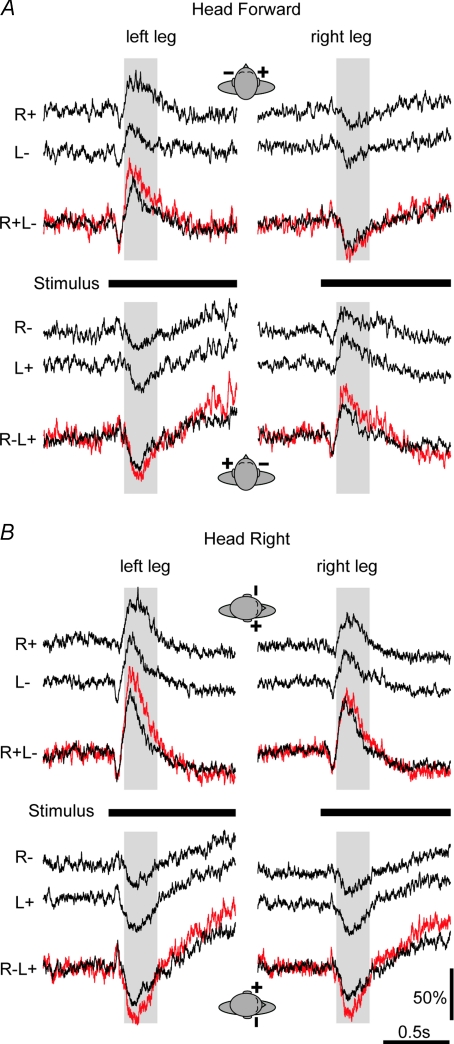
Figure 2. GVS-evoked EMG responses.
Group mean GVS-evoked EMG response of medial gastrocnemius muscles. Mean rectified EMG from left leg (left) and right leg (right) with head facing forward (A) or to the right (B). Black traces in each panel show from top the response to right-sided monaural stimulation, left-sided monaural stimulation, and binaural stimulation. The polarity of each side is denoted by sign (+ for anode, – for cathode). Red traces show the result of summing the two respective monaural responses. Time of stimulation is shown by the thick horizontal bar. Shaded area starts at 120 ms latency and denotes the first 250 ms of the medium-latency EMG response, which is responsible for the observed body sway. Data from Experiment 1.

