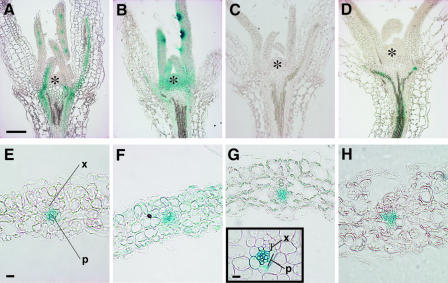
Figure 2.
Histological Analyses of GUS Expression Patterns.
(A) to (D) Longitudinal sections through 8-day-old seedlings of gCO:GUS (A), gTFL2:GUS (B), and pFT:GUS (C) in Col and pFT:GUS in tfl2-2 (D).
(E) to (H) Transverse sections through leaves of gCO:GUS (E), gTFL2:GUS (F), and pFT:GUS (G) in Col and pFT:GUS in tfl2-2 (H).
Asterisks indicates the SAM. P, phloem; X, xylem. Bars = 0.1 mm in (A) for (A) to (D), 10 μm in (E) for (E) to (H), and 10 μm for the inset in (G).

