Figure 3.
tfl2 Affects Both the CO-Dependent and CO-Independent Expression of FT.
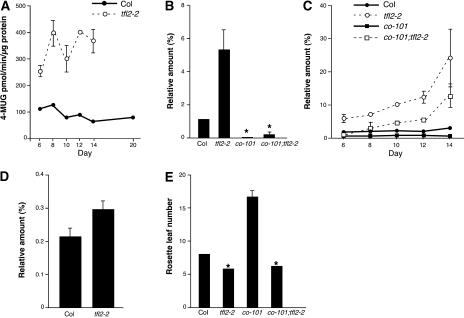
(A) Quantitative GUS expression analysis of pFT:GUS in Col (solid line) and tfl2-2 (dashed line). GUS activity is shown as the mean ± se of 4-methylumbelliferyl glucuronide·min−1·μg−1 protein of three independent experiments.
(B) to (D) Real-time quantitative RT-PCR analysis of FT ([B] and [C]) and CO (D) expression. The same RNA extract was used for the experiments shown in (B) and (D). These data are normalized to the amount of ACT2 (set as 100%) and are means ± se of three independent experiments.
(B) FT expression levels in 6-day-old Col, tfl2-2, co-101, and co-101 tfl2-2 seedlings.
(C) FT expression over time in Col, tfl2-2, co-101, and co-101 tfl2-2 seedlings.
(D) CO expression levels in 6-day-old Col and tfl2-2 seedlings.
(E) Flowering time measured as the mean number (±se) of rosette leaves at flowering in Col, co-101, tfl2-2, and co-101 tfl2-2 (n = 27, 7, 27, and 9, respectively). All plants were grown under long-day conditions. Asterisks indicate data that do not show statistically significant differences.

