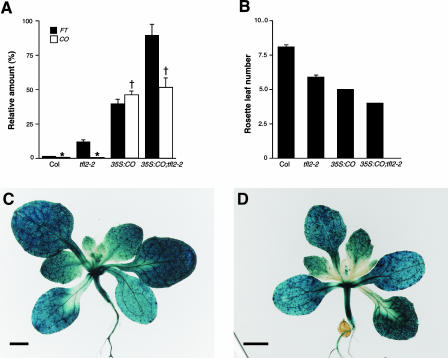
Figure 5.
Roles of TFL2 during FT Repression in the CO Overexpressor.
(A) Real-time quantitative RT-PCR analysis of FT (closed bars) and CO (open bars) expression in 12-day-old seedlings of Col, tfl2-2, 35S:CO, and 35S:CO tfl2-2. The data are normalized to the amount of ACT2 (set as 100%) and are means ± se of three independent experiments. There was no statistically significant difference among genotypes marked with the same symbols.
(B) Flowering time measured as the mean number (±se) of rosette leaves at flowering in Col, tfl2-2, 35S:CO, and 35S:CO tfl2-2 (n = 27, 27, 43, and 22, respectively).
(C) and (D) Whole-mount analysis of pFT:GUS expression in 35S:CO (C) and 35S:CO tfl2-2 (D). Bars = 1 mm.

