Figure 3.
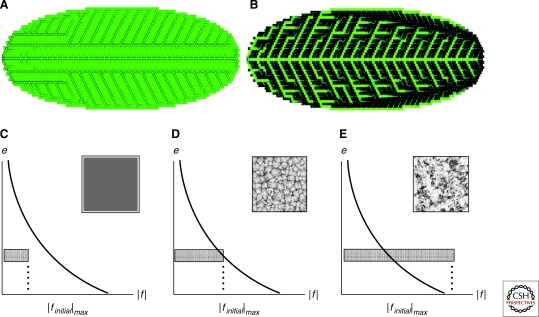
Models of vein formation. (A and B) Auxin patterns formed in the flux-based model by Feugier et al. (Feugier et al. 2005) (adapted with permission from Elsevier). In (A), the distribution of efflux mediator to each cell membrane is independent and veins show lower auxin concentration than the surrounding tissue. The auxin concentration is higher in the veins (as observed experimentally) when the efflux mediator is competitively reallocated between the cell membranes (B). (C–E) Analysis of pattern formation capabilities of the flux-based model depending on the initial conditions and parameters from Fujita and Mochizuki. The thick line represents a separatrix of the system. Only for a specific choice of initial conditions are veinlike patterns formed (D). Outside these conditions, the system switches to homogeneous auxin distribution (C) or patches of high auxin concentration (E). (Fujita and Mochizuki 2006) (adapted with permission from Elsevier.)

